|
|
Last Modified on Oct 21, 2024
The Fortress Law Group, LLC knows that as you look to understand the safety of your local area, it may be helpful to review Ohio’s crime rate by city to gain a full and comprehensive understanding of the local atmosphere. This data may be helpful if you are moving to a new area, if you are looking to understand your current area’s crime climate, or if you are hoping to be a more informed resident.
Crime Rates By City: Lowest Crime Rates
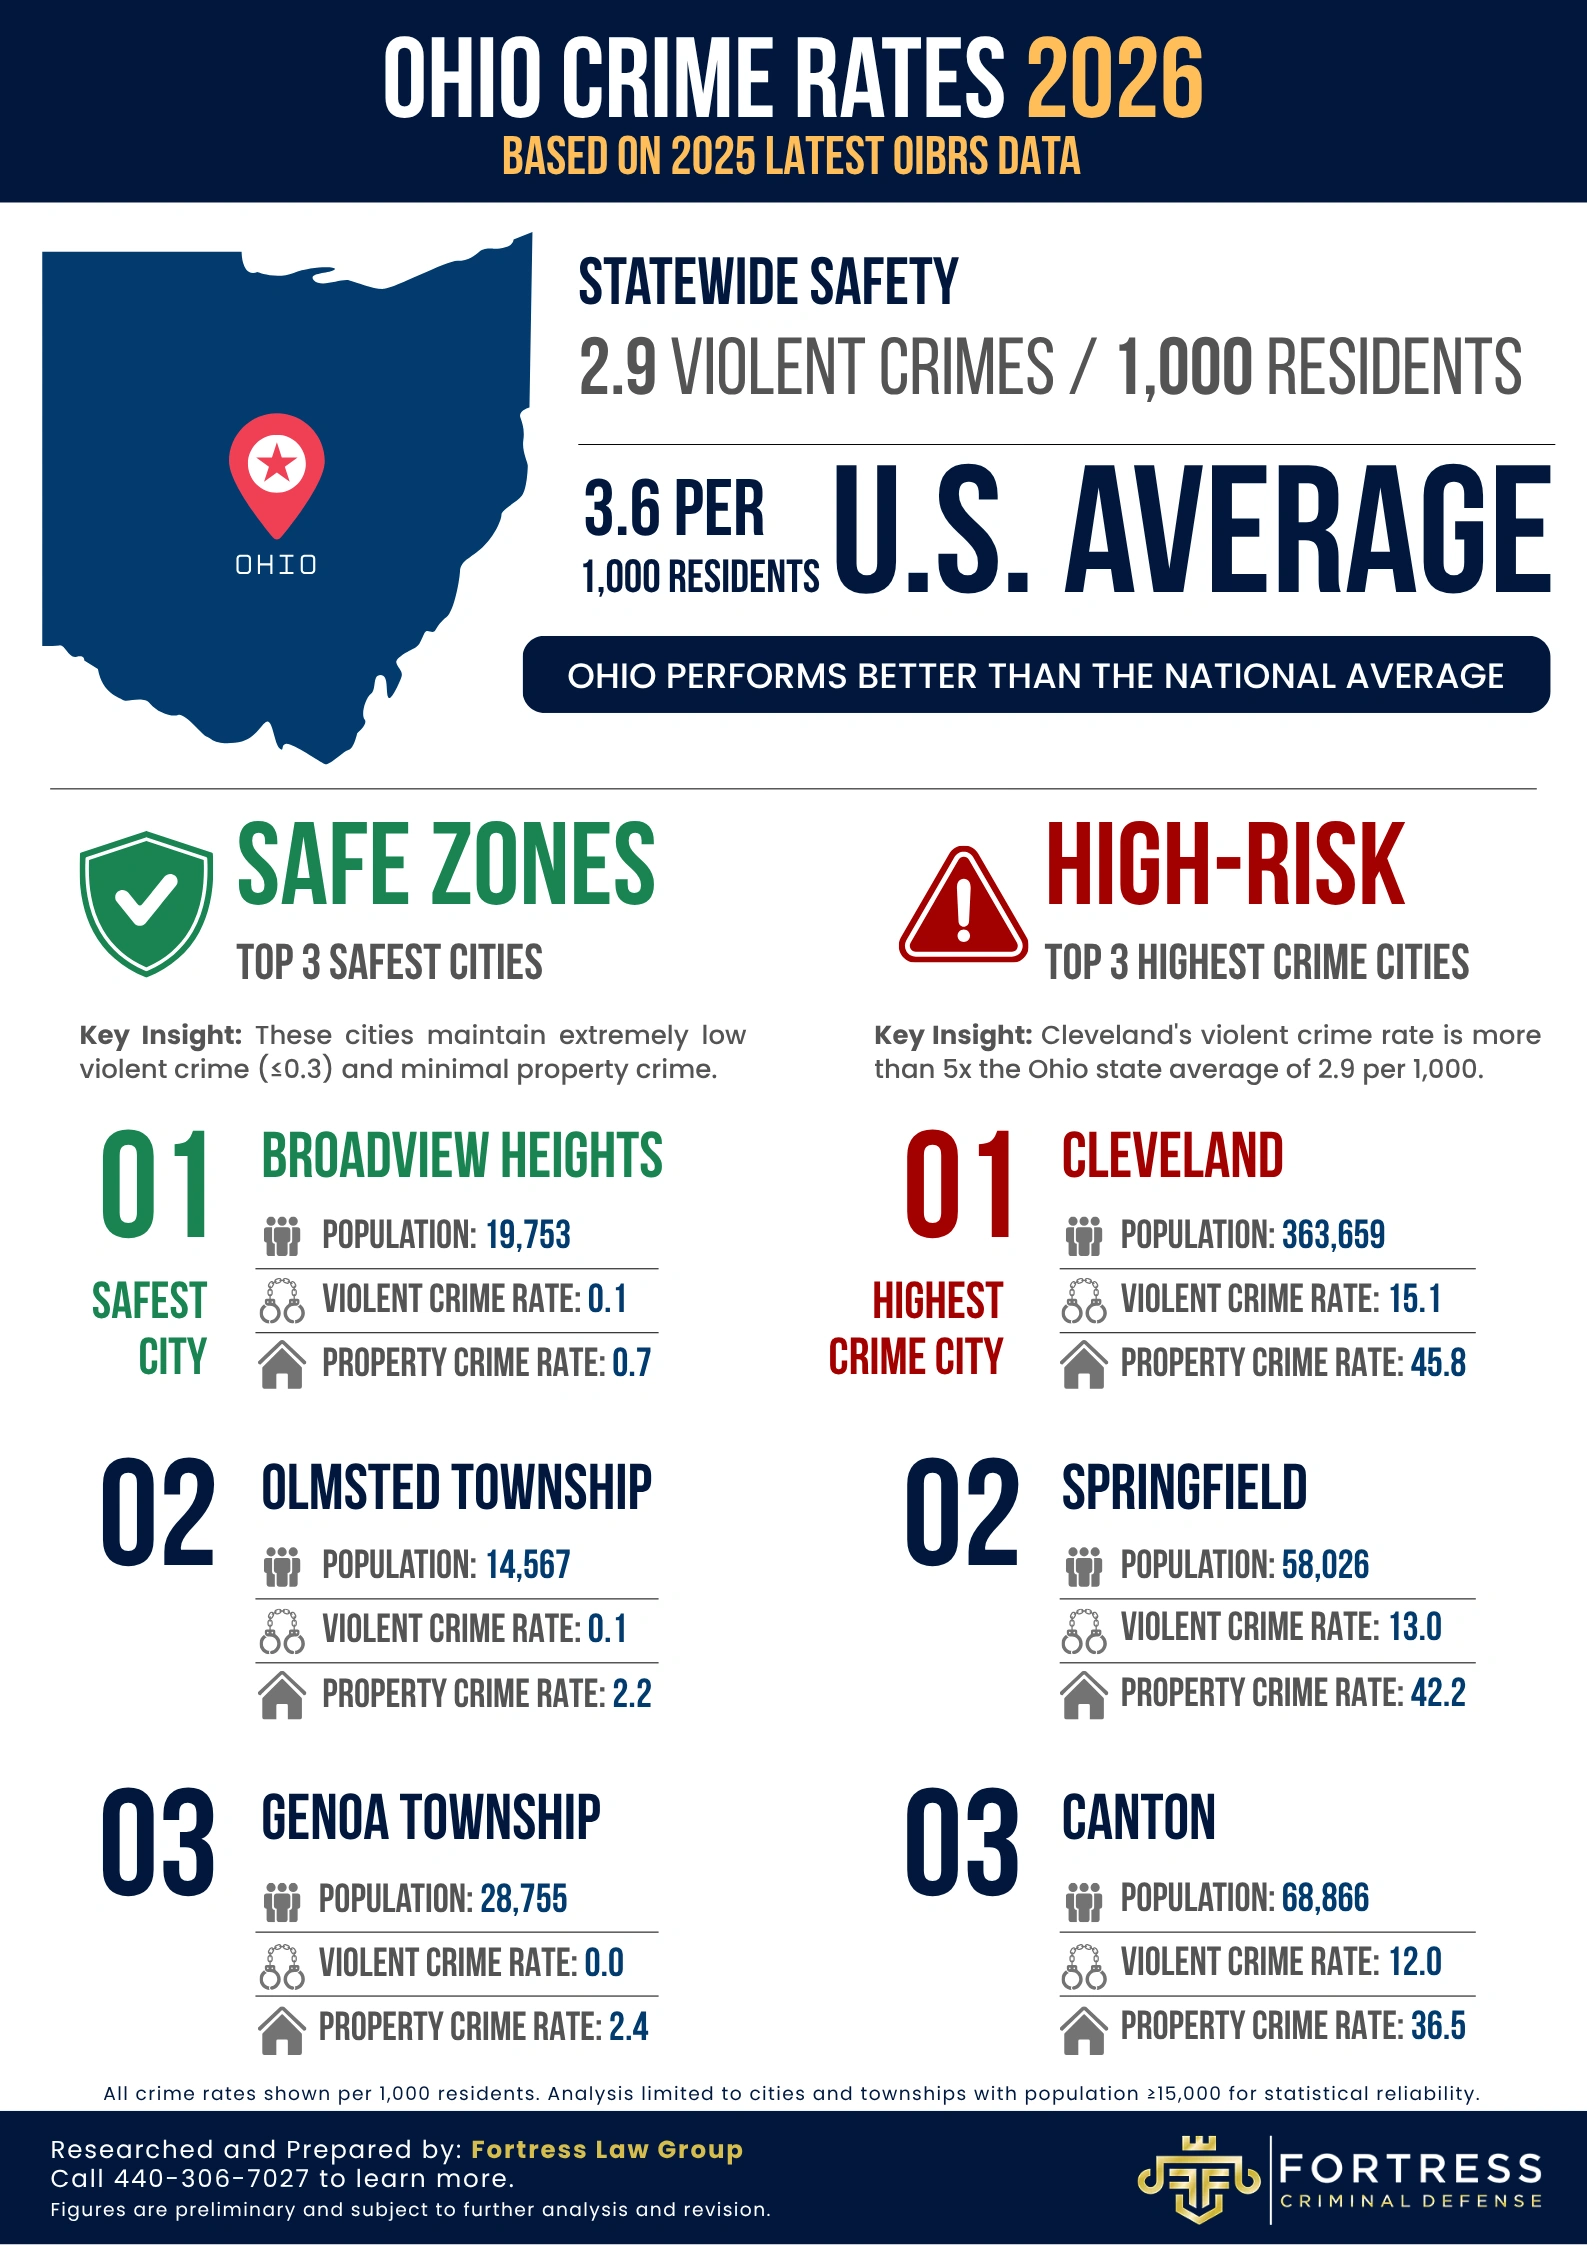
The following cities are considered to be some of the safest places to live in Ohio, offering secure neighborhoods and lower-than-average crime rates. Below is a list of the cities with the lowest crime rates in Ohio, based on 2025 OIBRS data:
- Broadview Heights. A population of 19,753 residents with a violent crime rate of 0.1 per 1,000 residents and a property crime rate of 0.7 per 1,000 residents.
- Olmsted Township. A population of 14,567 residents with a violent crime rate of 0.1 per 1,000 residents and a property crime rate of 2.2 per 1,000 residents.
- Genoa Township. A population of 28,755 residents with a violent crime rate below 0.1 per 1,000 residents and a property crime rate of 2.4 per 1,000 residents.
- Brecksville. A population of 14,038 residents with a violent crime rate of 0.4 per 1,000 residents and a property crime rate of 4.6 per 1,000 residents.
- Avon Lake. A population of 26,615 residents with a violent crime rate of 0.5 per 1,000 residents and a property crime rate of 3.0 per 1,000 residents.
Crime Rates By City: Highest Crime Rate
The cities in Ohio with the highest crime rates typically report higher incidents of violent crime like assaults, robberies, and homicides, along with property crimes. Below is a list of the cities with the highest crime rates in Ohio, based on 2025 OIBRS data:
- Cleveland. A population of 363,659 residents with a violent crime rate of 15.1 per 1,000 residents and a property crime rate of 45.8 per 1,000 residents.
- Springfield. A population of 58,026 residents with a violent crime rate of 13.0 per 1,000 residents and a property crime rate of 42.2 per 1,000 residents.
- Dayton. A population of 136,047 residents with a violent crime rate of 12.9 per 1,000 residents and a property crime rate of 41.3 per 1,000 residents.
- Canton. A population of 68,866 residents with a violent crime rate of 12.0 per 1,000 residents and a property crime rate of 36.5 per 1,000 residents.
- Whitehall. A population of 19,900 residents with a violent crime rate of 8.8 per 1,000 residents and a property crime rate of 56.9 per 1,000 residents.
Ohio Crime Rate
According to the most recent FBI Uniform Crime Reporting data (2024 reporting year), Ohio recorded a violent crime rate of approximately 2.9 incidents per 1,000 residents (293.7 per 100,000), which remains below the national average of 3.6 per 1,000 residents (359.1 per 100,000). Ohio’s violent crime rate has stayed consistently below the national average for the past decade.
Among all Ohio cities reporting to OIBRS in 2025, Cleveland recorded the highest violent crime rate at 15.1 incidents per 1,000 residents. The most commonly reported violent offense in Ohio is aggravated assault, which accounts for about 67 percent of reported violent crimes, followed by rape, robbery, and murder.
Sources: Ohio Incident-Based Reporting System (OIBRS) 2025 reporting year; Ohio Legislative Budget Office; FBI Uniform Crime Reporting Program. All rates expressed per 1,000 residents.
What Can Crime Rates Actually Tell Me
Crime rates can offer a snapshot of the frequency of criminal activity in a particular area, helping individuals and entities understand the overall safety and security of a community. These rates can indicate whether crime is increasing or decreasing over time in a specific area. An upward trend may signal worsening conditions such as economic hardship, increased substance use, or strained law enforcement resources, while a decrease may reflect successful crime prevention efforts.
While crime rates offer valuable insights into public safety, socio-economic conditions, and law enforcement effectiveness, they should be viewed in context and not in isolation. Citywide averages often mask significant variation between neighborhoods.
FAQs
What City in Ohio Has the Highest Crime Rate?
Based on 2025 OIBRS data, Cleveland has the highest crime rate among major Ohio cities. The city has a population of 363,659 residents, with a violent crime rate of 15.1 per 1,000 residents and a property crime rate of 45.8 per 1,000 residents. Cleveland has frequently been reported as a city with one of the highest crime rates in the state and nationwide.
What City in Ohio Has the Lowest Crime Rate?
Based on 2025 OIBRS data, Broadview Heights has one of the lowest crime rates in Ohio. Broadview Heights has a population of 19,753 residents with a reported violent crime rate of 0.1 per 1,000 residents and a property crime rate of 0.7 per 1,000 residents.
Where in Ohio Is It Safe to Live?
Several cities and communities in Ohio are known for their safety, low crime rates, and family-friendly amenities. Some of the safest places to live in the state include Broadview Heights, Olmsted Township, Genoa Township, Brecksville, Avon Lake, Bay Village, and Hamilton Township. If you are looking to move to a city in Ohio, it is helpful to research details like crime rates, school quality, and access to public services to determine overall livability and safety.
What Crime Is Most Common in Ohio?
In Ohio, property crimes are the most frequently reported offenses. These include larceny-theft, burglary, and motor vehicle theft. Larceny-theft alone accounts for roughly 73 percent of all property crimes in the state. Among violent crimes, aggravated assault is the most common, followed by rape, robbery, and murder. Urban areas facing economic challenges typically report higher crime rates than suburban or rural areas, in part due to population density.
Where Can You Find Accurate Crime Rates?
To find accurate crime rates in Ohio, individuals can rely on several reputable sources that provide comprehensive and up-to-date data, including the Ohio Incident-Based Reporting System (OIBRS), the FBI Uniform Crime Reporting (UCR) Program, the Bureau of Justice Statistics (BJS), the Ohio Department of Public Safety, the Ohio Legislative Budget Office, and local law enforcement agencies. These resources offer a wide range of data, and it is helpful to review them together, as any single platform may not capture every reported incident.
Speak With a Trusted Local Criminal Defense Lawyer Today
If you are navigating the aftermath of a crime or arrest, it is essential to partner with a local criminal defense lawyer in Cleveland who understands the legal landscape of the state and how courts prosecute alleged offenses. By setting up an initial consultation with the Fortress Law Group, LLC, you will meet with legal professionals who are ready to listen with an empathetic ear and help develop a strategic defense on your behalf.
Data Sources: Ohio Incident-Based Reporting System (OIBRS), 2025 reporting year; FBI Uniform Crime Reporting Program, Crime in the United States 2024; Ohio Legislative Budget Office. All city-level crime rates are expressed per 1,000 residents. Not all Ohio law enforcement agencies report to OIBRS, and reporting completeness varies by jurisdiction. Crime rates vary significantly by neighborhood within each city. Figures are subject to revision as additional data is reported. This content is provided for general informational purposes only and does not constitute legal advice.
Ohio Criminal Defense Resource: